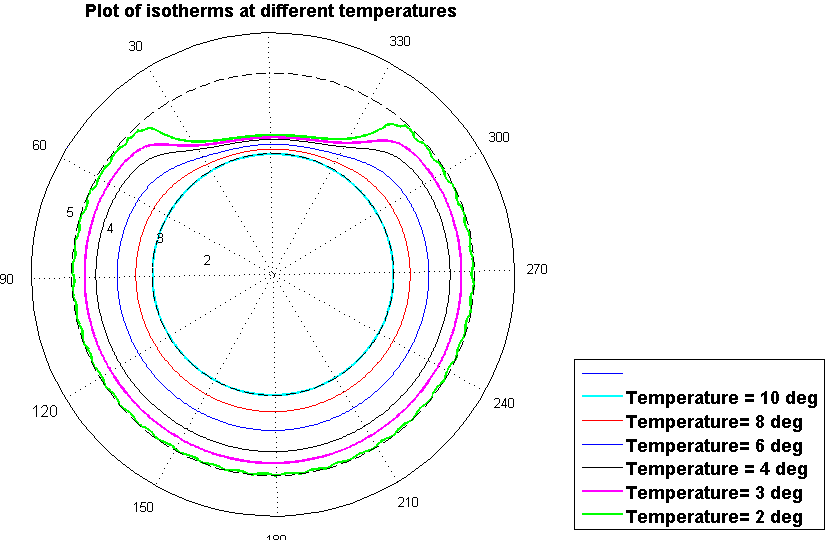
A pipe of thickness 2 and inner radius 3 is submerged in the ground at 2 °C leaving a space of 0.5 open to a -20 °C-environment. I put my 0° line vertically through the center.
To solve this problem, I applied the Laplacian equation in terms of temperature and radius. After applying all the boundary and initial conditions, I solved for expressions of the Fourier terms. Using MATLAB, I solved for many Fourier terms ( up to 400 terms).
400 terms ! Accuracy does not change much with this much terms. I only did it to get a better estimate of the isotherms. If I were to do this again, I would use MATLAB bult-in solvers: e.g., fzero() and fminbnd(). If you have difficulty setting up the problem, I recommend referring to this book : “Advanced Engineering Mathematics – Michael D. Greenberg, 2nd “.I cannot post my solution, but feel free to take a look at my Matlab figures .
Results
My analytical solution gave the numerical results that I expected. In addition, my method was easier to solve than what some people did in the class.
| Time line | Spring 2011 |
| Class Individual Project |
