
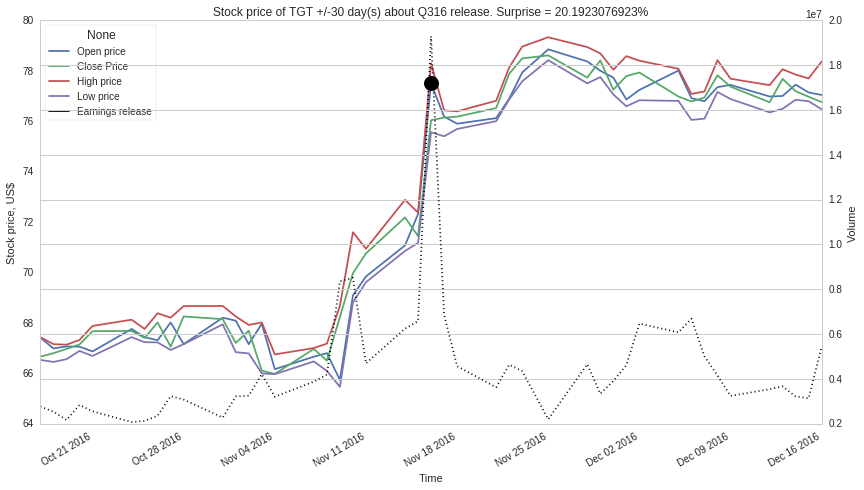
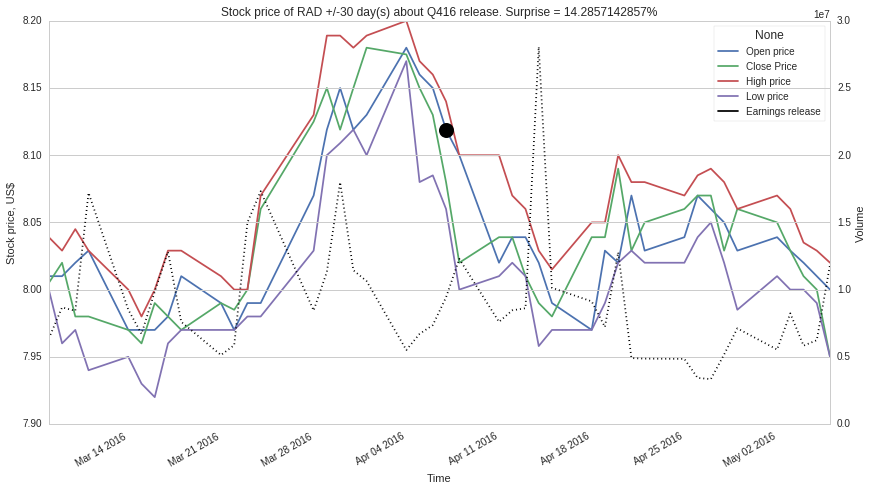
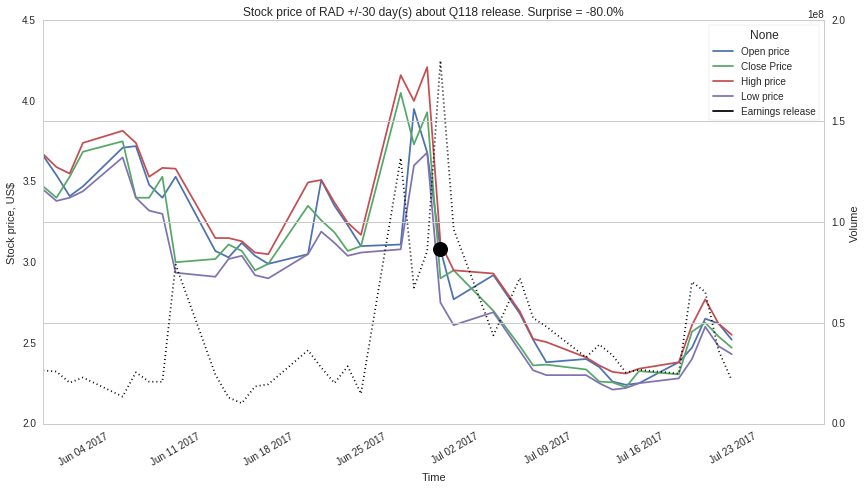
Stock price climbs in anticipation of good earnings. If earnings per share (EPS) beat Wall Street expectations, then depending on Surprise %, the price changes. The black dot represents the earnings report release. Image generated using Python.
In this project, my goal is to model and improve my investment strategy. I test the flaws, strengths and limits of the strategy.
My research led me to Quantopian. It is an online platform that enables one to program trading strategies in Python and then back-test, live-test, live-trade and possibly license the same strategies. My draw to Quantopian was the availability of free-of-cost minute-by-minute stock price data and other data.
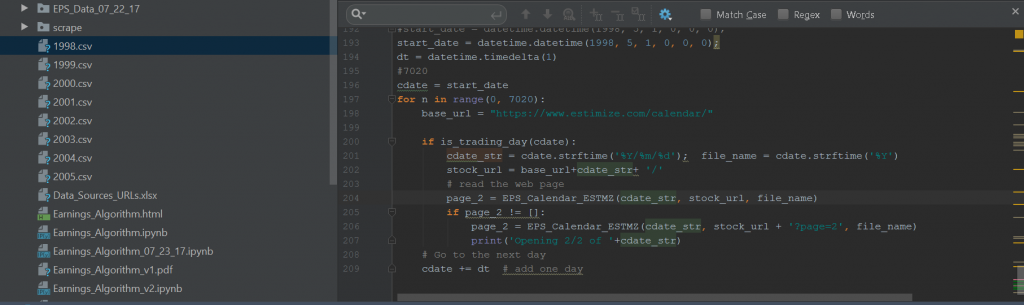
Through experience, I learned that programming the trading strategy outside the Quantopian platform can be very time-consuming. With your own code, you can be bogged down in tedious tasks such as fixing dates (line #56), plotting results (line #66), etc instead of focusing on the actual trading algorithm. I share a portion of my home-brewed program to show how tedious it can be. One can use zipline package to ease the pain.
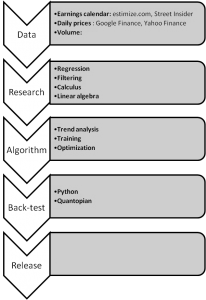
Data acquisition
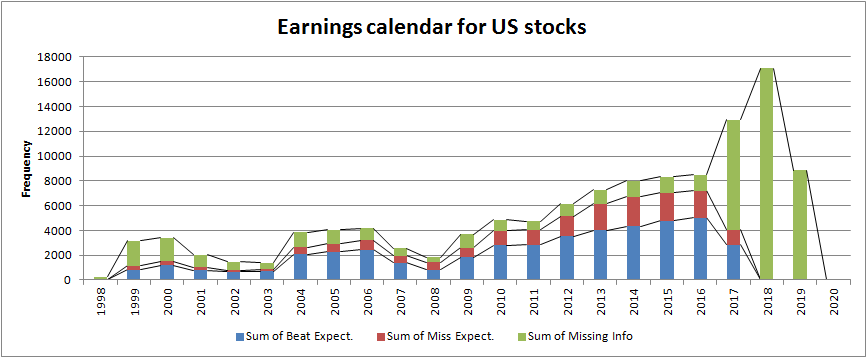
Using Python and iMacros scripts, I downloaded earnings calendars of 2,143 US companies starting from 1998 to 2020.
Trend analysis
For a select companies, I analyzed historical stock prices around the earnings calendar. I find a few observable trends before and after earnings releases as I demonstrate in the figures below:
Regression
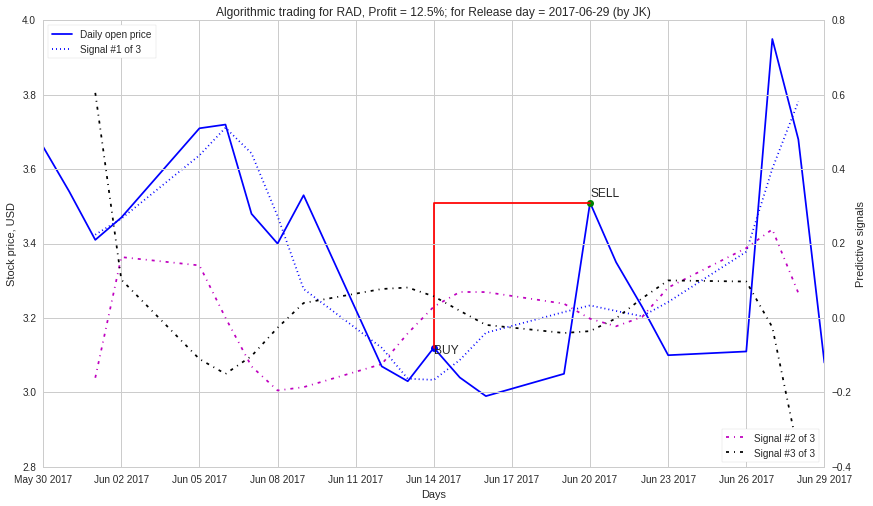
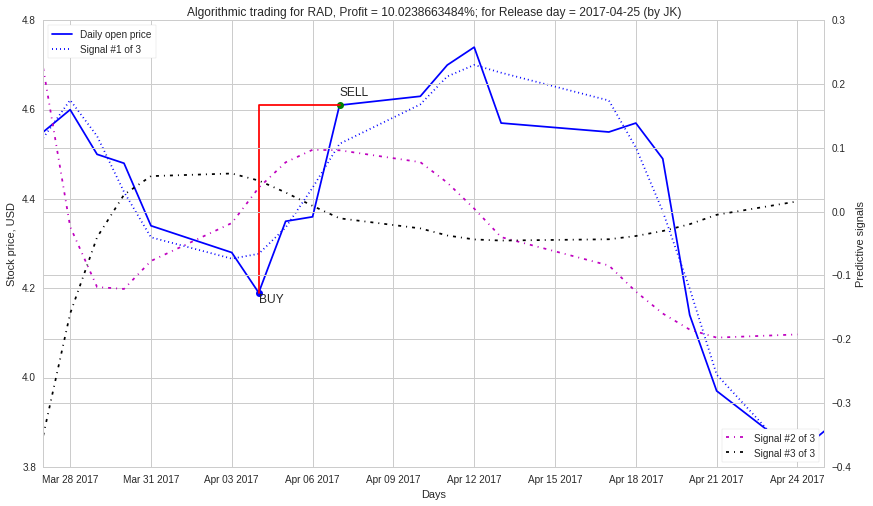
Here, I mathematically derived 3 signals to identify optimum buy and sell times before earnings release day. Some traders widely use the Moving Average Convergence Divergence (MACD) signal.
Back-testing
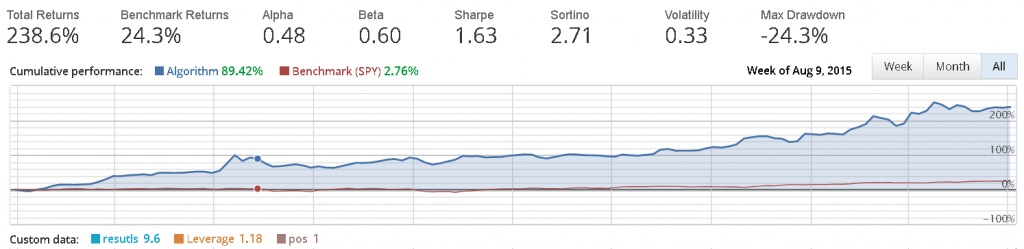
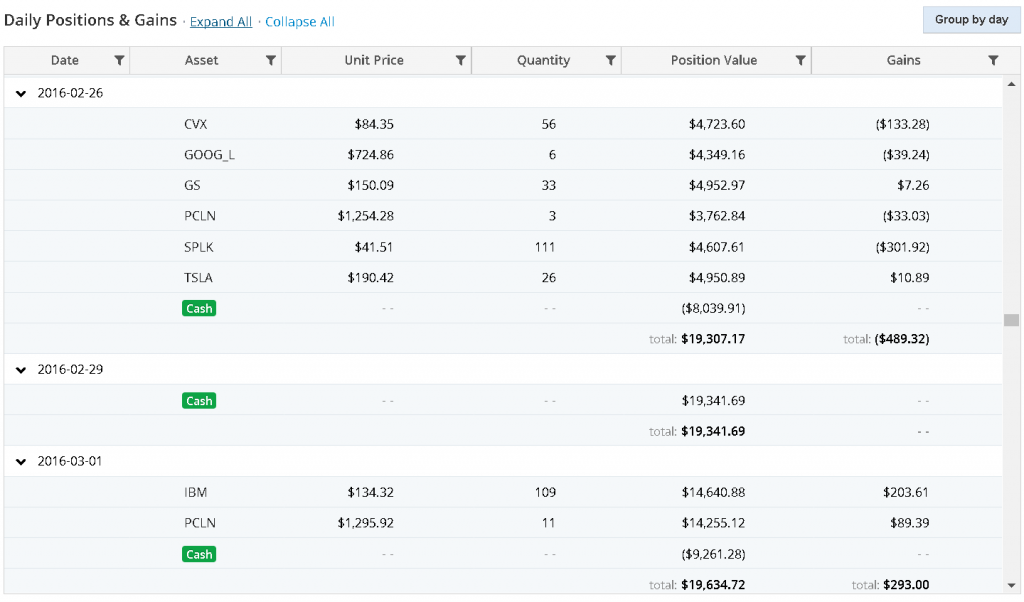
I am currently back-testing my earnings-based algorithm on Quantopian’s Python-based platform. A sample result is shown in the plot below. The platform executes the algorithm over a specified period, starting capital (US$ 10,000.00), type of securities, a set of stocks, commission and other brokerage fees and of course, the user-generated algorithm written in Python. Quantopian then outputs the total returns of the algorithmic trades among other variables.
Example code of programming for finance in Python |
1    # Author: Jonah Kadoko
2    # Date: 07-19-17
3    # Description:
4    # The goal of this project is to be able to test specific trading algorithms using Python
5
6    import matplotlib.pyplot as plt
7    import matplotlib.dates as mdates
8    import datetime
9    import numpy as np
10   import urllib
11
12   def month2num(month):
13       # this function changes the month from letters to numbers
14       month_list ={
15           'Jan' : 1,
16           'Feb' : 2,
17           'Mar' : 3,
18           'Apr' : 4,
19           'May' : 5,
20           'Jun' : 6,
21           'Jul' : 7,
22           'Aug' : 8,
23           'Sep' : 9,
24           'Oct' : 10,
25           'Nov' : 11,
26           'Dec' : 12
27           }
28       return month_list[month]
29
30   def stock_data(ticker):
31       fig = plt.figure()
32       ax1 = plt.subplot2grid((1,1), (0,0))
33       # ticker = 'GOOG'
34       stock_price_data = []
35       open_p = []; vol = []; close_p = []; trade_date = []
36       stock_price_url='https://www.google.com/finance/historical?output=csv&startdate=Jul+20+2008&enddate=Jul+19+2017&q='+\
37           ticker
38       raw_data = urllib.request.urlopen(stock_price_url).read().decode()
39       split_raw_data = raw_data.split('\n')
40       print(split_raw_data[0]+'\n')
41
42       for line in split_raw_data:
43           split_line = line.split(',')
44           if '\ufeff' in line or len(split_line) != 6:
45               print('debug_1')
46           else:
47               # print('debug_2')
48               # print(split_line[1])
49               # stock_price_data.append(line)
50               open_p.append(float(split_line[1]))
51               close_p.append(float(split_line[4]))
52               if '-' in split_line[5]:
53                   vol.append(0)
54               else:
55                   vol.append(float(split_line[5]))
56               # Fix date and timing
57               split_date=split_line[0].split('-')
58               week_day = int(split_date[0]);
59               mon = month2num(split_date[1]);
60               yr = 2000 + int(split_date[2])
61               date_temp = datetime.datetime(year=yr, month=mon, day=week_day)
62               trade_date.append(mdates.date2num(date_temp))
63               # print(date[0].isoformat())
64               # print(split_line[0])
65       # print(stock_price_data[0:1])
66       ax1.plot_date(trade_date, open_p, 'red')
67       plt.xlabel('Date')
68       plt.ylabel('Stock price,
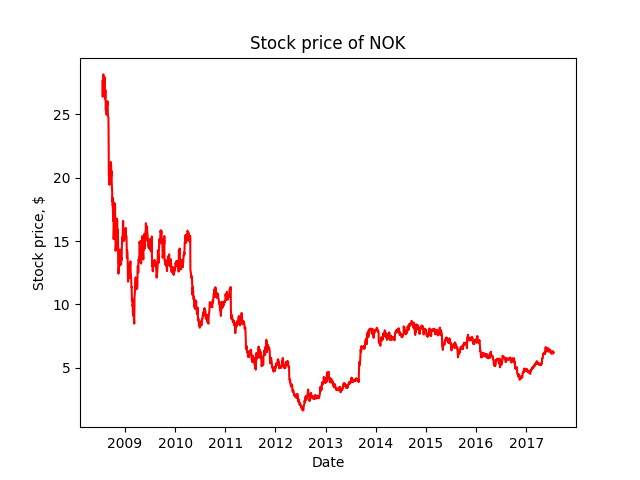
)
69       plt.title('Stock price of '+ticker)
70       plt.show()
71
72
73   stock_data("NOK")
74